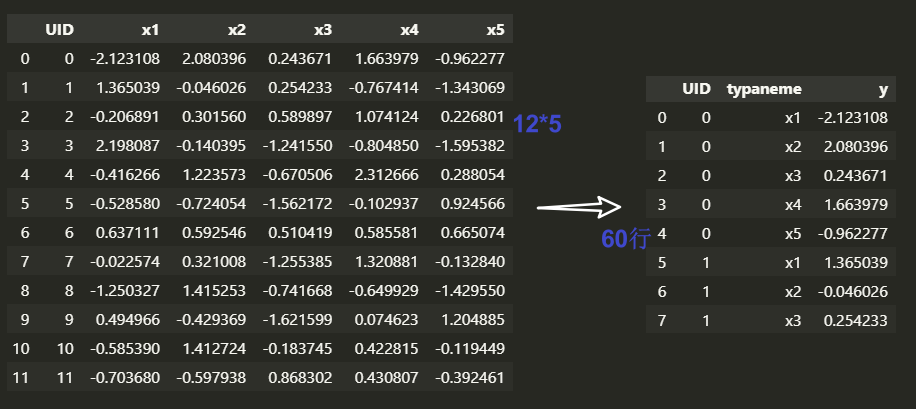
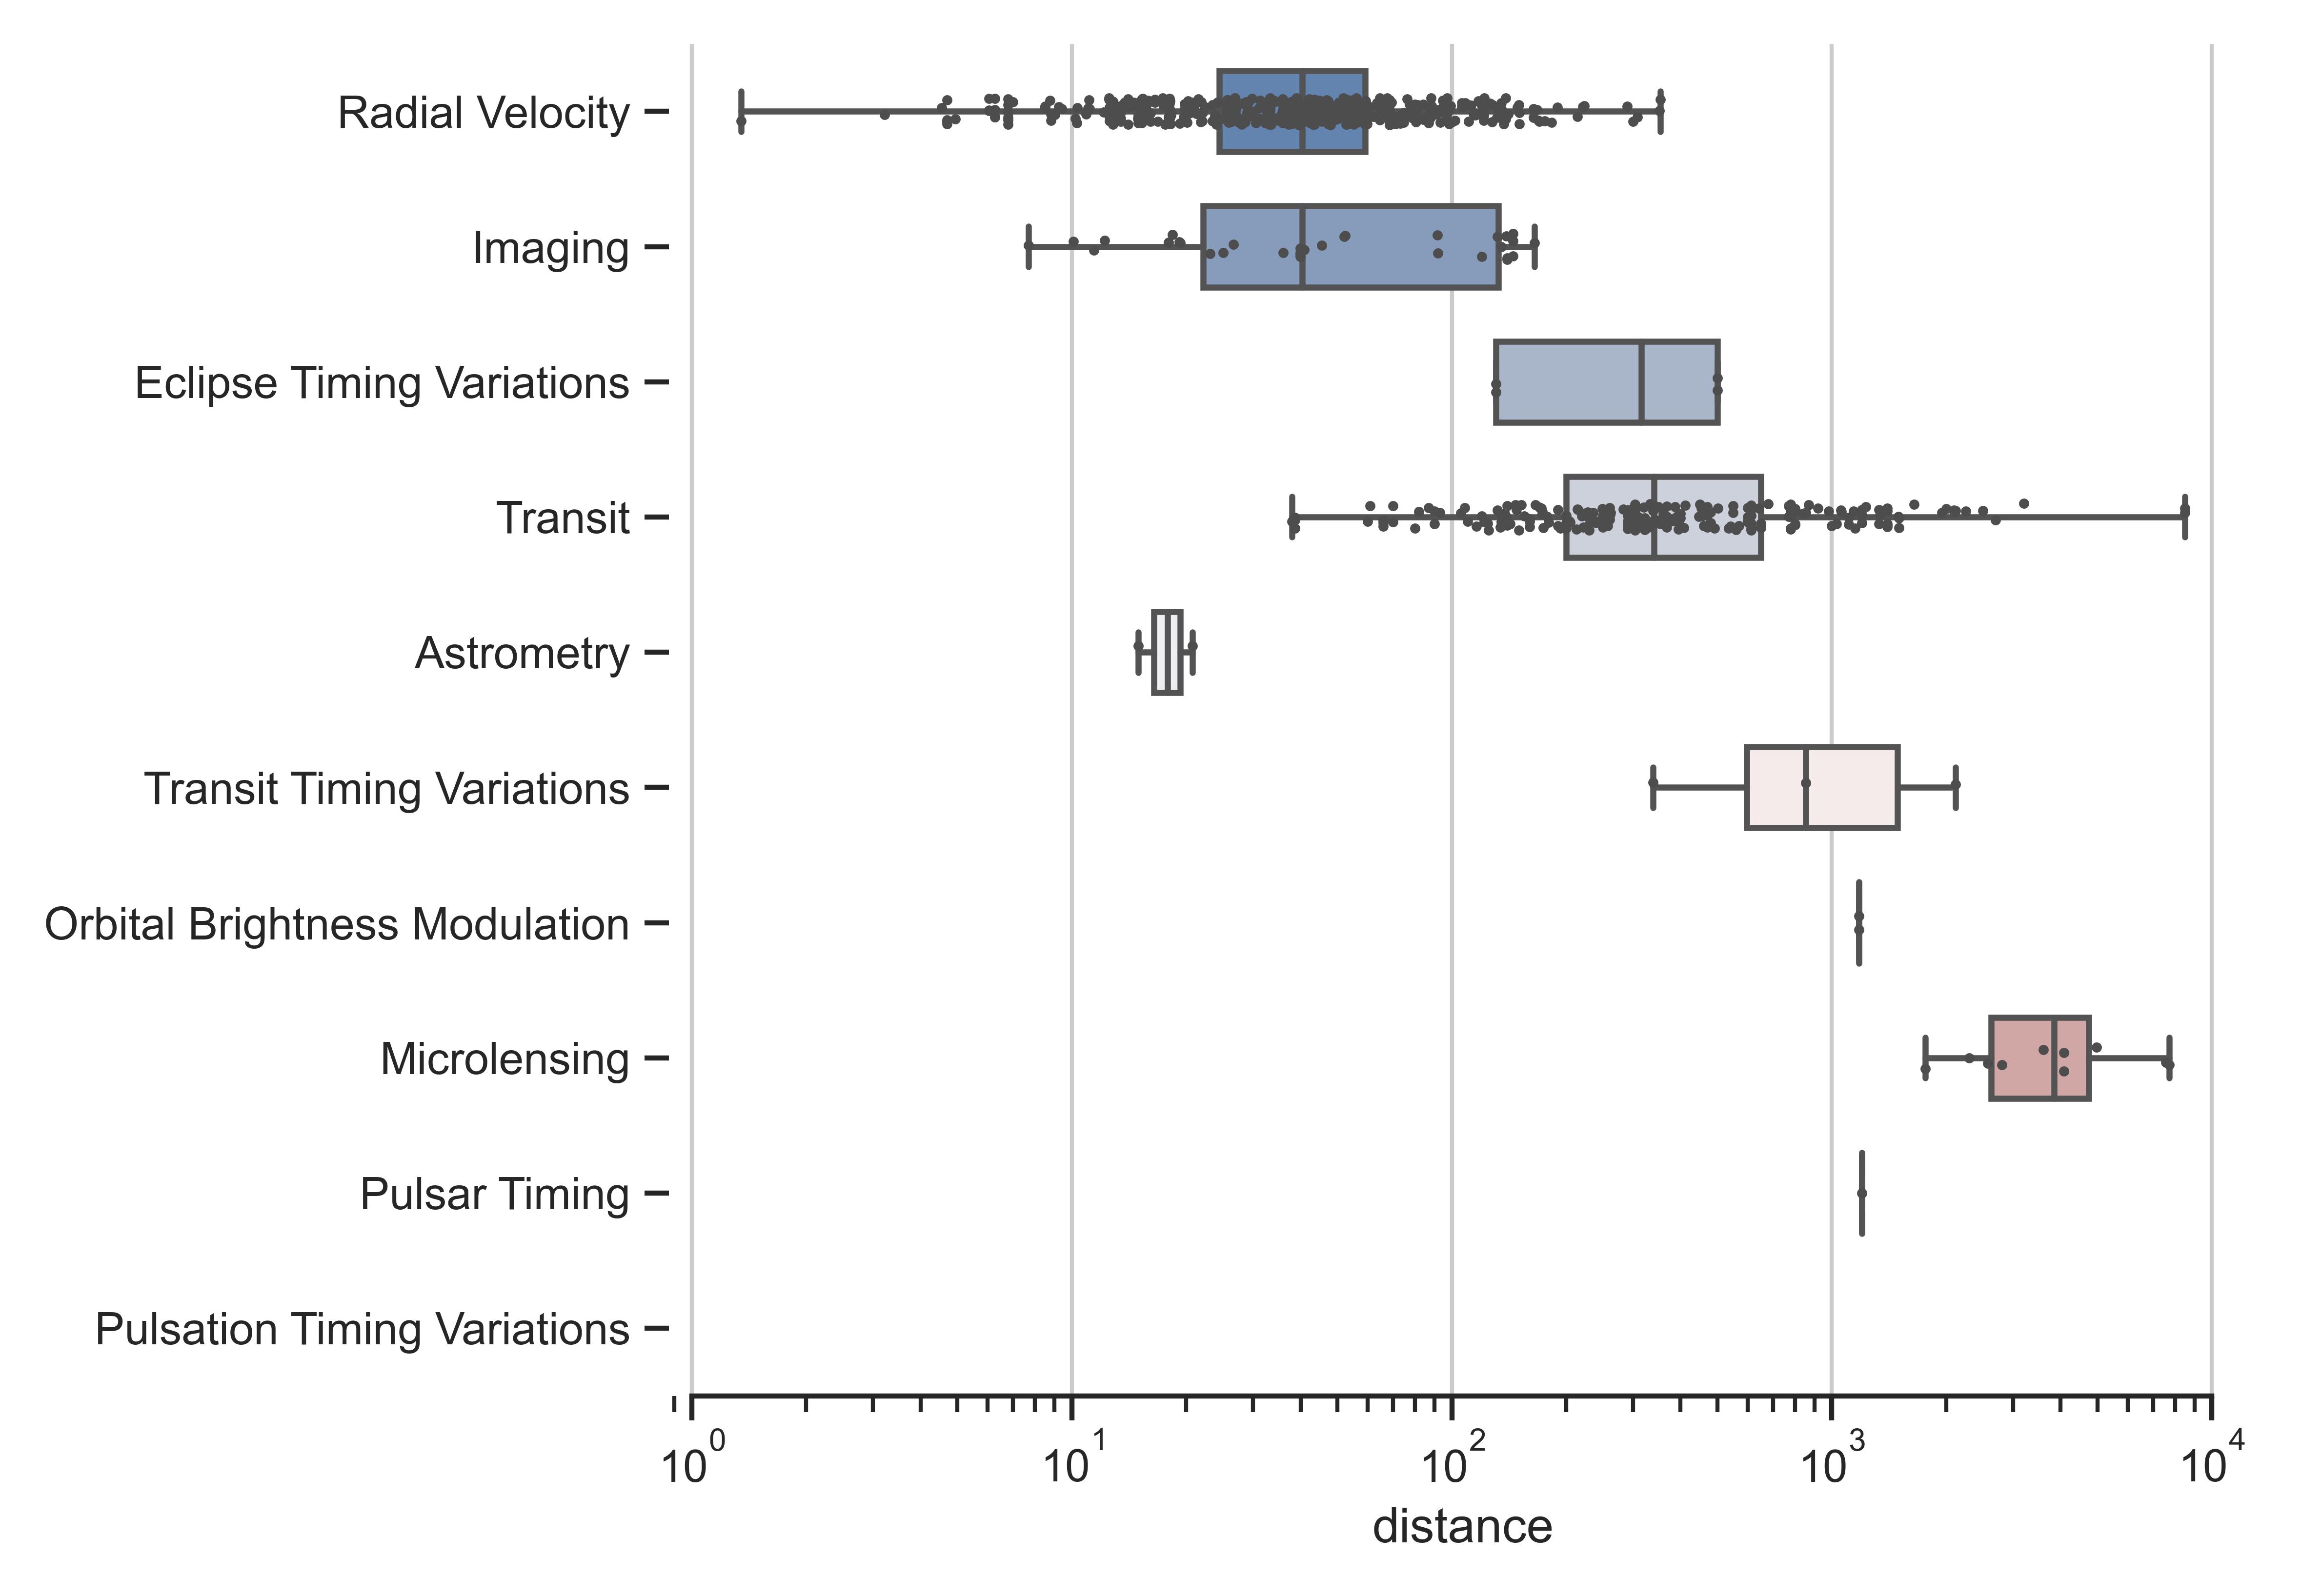
在绘图时有时需要将本地的表格转换为目标接口要求的格式 -> reshape。以seaborn绘制多变量箱线图为例,其默认数据接口需要的是一列数值加一列类型,但是本地通常是多列,因此需要转换,此外如果涉及到排序也需要自行调整,以下为案例代码记录以供复用:
DataFrame格式转换
比如我的表格为如下的,n行6列的表格,其中5列代表五个不同的变量,需要将其转换为三列:UID, Typename, Value
1
2
3
4
5
6
7
8
9
| df = pd.DataFrame(
{
"UID": range(12),
"x1": np.random.randn(12),
"x2": np.random.randn(12),
"x3": np.random.randn(12),
"x4": np.random.randn(12),
"x5": np.random.randn(12),
})
|

使用pd.stack():
1
2
3
4
| df2 = df.set_index("UID")
df2 = df2.stack().reset_index()
df2.columns = ["UID","typaneme","y"]
df2
|
不使用函数自行定义:
1
2
3
4
5
6
7
8
9
10
11
12
13
14
15
16
17
| def stack_data(datatable, typenames, col_id):
uids = []
names = []
values = []
for col in typenames:
value = list(datatable[col])
names.extend([col]*len(value))
values.extend(value)
uids.extend(datatable[col_id])
df_temp = pd.DataFrame({col_id:uids,"typename":names, "y":values})
return df_temp
cols = list(df.columns[1:])
typenames = cols
df_temp = stack_data(df,typenames,"UID")
df_temp
|
如果不需要UID列
1
2
3
4
5
6
7
8
9
10
11
12
13
14
15
| def stack_data(datatable, typenames):
names = []
values = []
for col in typenames:
value = list(datatable[col])
names.extend([col]*len(value))
values.extend(value)
df_temp = pd.DataFrame({"typename":names, "y":values})
return df_temp
cols = list(df.columns[1:])
typenames = cols
df_temp = stack_data(df,typenames)
df_temp
|
按照统计值排序
如果是直接排序,直接对得到的表格进行排序即可,df.sort_values(by=["y"], scending=False,ignore_index=False)
1
2
3
|
df_temp.sort_values(by=["y"], ascending=[False],ignore_index=False)
|
有时候需要先对列进行排序再进行堆叠,比如按照中位数或者均值排列
1
2
3
4
5
6
7
8
9
10
| df3 = df[df.columns[1:]]
meds = df3.median()
meds = meds.sort_values(ascending=False)
cols_sort = list(meds.index)
cols_sort.insert(0,"UID")
df3 = df[cols_sort]
....
|
Seaborn绘图示意
seaborn.boxplot(data=None, *, x=None, y=None, hue=None, order=None, hue_order=None, orient=None, color=None, palette=None, saturation=0.75, width=0.8, dodge=True, fliersize=5, linewidth=None, whis=1.5, ax=None, **kwargs)
实际上我们可以对该图进行定制,包括颜色,文字,线和箱等等,后续单独记一下boxplot的调参
1
2
3
4
5
6
7
8
9
10
11
12
13
14
15
16
17
18
19
20
21
22
23
24
| import seaborn as sns
import matplotlib.pyplot as plt
sns.set_theme(style="ticks")
f, ax = plt.subplots(figsize=(7, 6))
ax.set_xscale("log")
planets = sns.load_dataset("planets")
sns.boxplot(x="distance", y="method", data=planets,
whis=[0, 100], width=.6, palette="vlag")
sns.stripplot(x="distance", y="method", data=planets,
size=4, color=".3", linewidth=0)
ax.xaxis.grid(True)
ax.set(ylabel="")
sns.despine(trim=True, left=True)
|

参考

