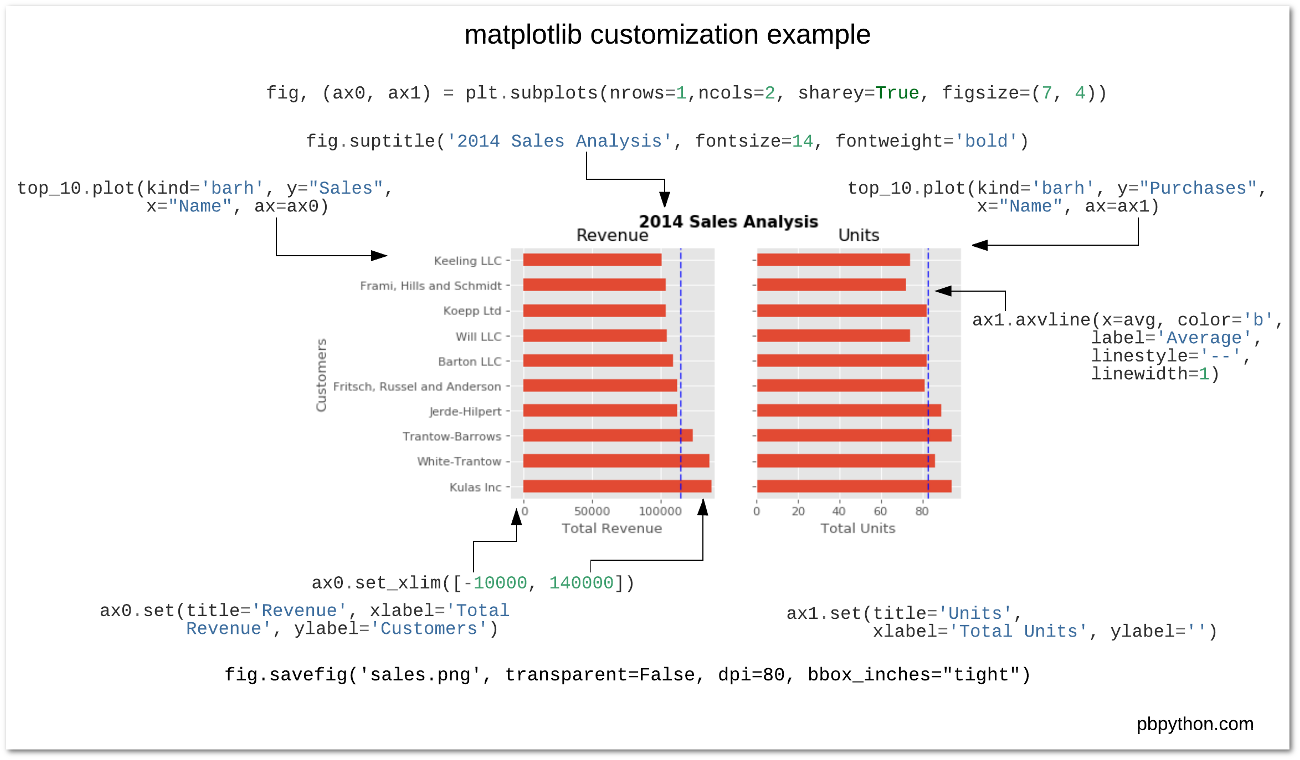
绘图技能是我一直想要拓展和延伸的一个技能。这一方面需要通过大量的输入来学习别人对图表的设计和呈现,学习色彩、布局等等……另一方面还要能够用代码来实现,而需要基于代码的可视化是一个比较繁琐的内容,需要学习和积累。故在此开始记录自己Python可视化的学习过程,当然,也便于代码的复用。本文主要涉及内容:
- Matplotlib中Figure的组成要素
- 主要元素的常用方法汇总
- 其他的诸如风格、字体、网格、图例、色带陆续总结……
一张好看的学术图表不仅能够更优雅简洁地传递信息,也能给人予美的享受。在撰写学术论文的过程,耗费大量时间的除了做实验,另一个一定是作图了,要通过几张图把信息很好地呈现出来,需要费不少功夫。
本系列笔记主要参考:Matplotlib usage, Matplotlibapi文档,Matplotlib Gallery,部分参考Rougier老师的开源书
另外,快速绘图备忘录下载,该备忘录有两张大图(基础绘图;色彩及文字等),可以快速查看常见的绘图操作/函数,函数右侧的api还可以点击直达官网api文档详细介绍。

上图即通过matplotlib代码制作,详见book
图的组成
matplotlib最新版的文档做了较大的改版,提供了更全的api参考
下图是Matplotlib官方文档中提供的一张介绍图组成元素的图,很整洁,左图为旧版anatomy,右图为最新的文档anatomy里的图,我稍作改动放到了一起:

组成总览
Figure:所有绘图元素的顶级容器,大致可以理解为画布canvas。我们可以设置它的尺寸(figsize)、标题(suptile)、x标签(supxlabel)、背景颜色(facecolor )等属性,背景默认是透明 transparent=True。
Axes:相当于Subplot,子图,是我们实际的绘图区域,为矩形。一张图可以有多个子图(Axes),如上图
- Spines: 图边,每个子图都有4条边,每条边有主副刻度线(Tick)+主副刻度标签(Tick labels)+边标签(Label),默认只显示左+下的Spine。
- Axis:默认显示的左和下方的两条Spines分别为yaxis,xaxis,属性同Spines。
- Line points...:绘制的图形,也就是我们要在axes上画的东西
- Legend:图例,每个axes都可以根据其上绘制的图形生成图例,也可以不依赖图形单独创建。
- Grid:网格线,自行选择是否添加(按照主副刻度线生成)
- Text:文本,可以作为注释说明添加到图上
- Annotation:可以添加连接线/箭头的文本,注释
Artist : Everything on the figure, including Figure, Axes, and Axis objects, is an artist. 理解为图元素。组成图
了解了组成部件,之后我们的学习任务主要就是了解和属性各个部件繁多的属性和属性调整的方法,以及组合。下一节即有针对性地看一下各个元素的属性方法等。
教程; 绘图思路快速入门
图的基本单元
任意的一张图,本质上是由以下三种要素的组合(莫明想起了GIS里的点线面hh):
- patchs:块,如background bars ……
- lines:线,如tick,line……
- texts:文本,如label title……
多数情况下我们都是使用绘图自带的默认设置,但是实际上,一张图的任一组成部分即上述部件都能够被访问和调整如我们可以像下面这样直接设置每个label加粗,这些方法都能够在文档中快速找到:
1
2
3
4
| fig, ax = plt.subplots(figsize=(5,2))
for label in ax.get_xaxis().get_ticklabels():
label.set_fontweight("bold")
plt.show()
|
🔥想强调的是,每个部件在我们创建了一个图形之后就有了类对应的实例(对类不熟悉的可以移步Python中的类),通过查阅文档我们可以看到该对象的所有属性及方法,进一步地我们可以按需检索并实现我们对图形想要进行的任意设置或调整,下面开始介绍并举例:
主要部件详解
虽然有文档,但是我还是要熟悉一些常见的属性方法,以使我们能够快速出图,至于最终成图的细节则可以再细扣。另外,以下所有均来自Matplotlib3.5官方文档,一些参数细节暂不展开讲,在后续的总结中再慢慢铺开
class matplotlib.figure.Figure, 类的属性及方法
1
2
3
4
| import matplotlib.pyplot as plt
fig = plt.figure(figsize=(5, 4))
fig, ax = plt.subplots()
|
常用属性及方法/函数:
1
2
3
4
5
6
7
8
9
10
11
12
13
14
15
16
17
18
19
20
21
22
23
24
25
26
27
28
29
30
31
32
33
34
35
|
class matplotlib.figure.Figure(figsize=None, dpi=None, facecolor=None, edgecolor=None, linewidth=0.0, frameon=None, subplotpars=None, tight_layout=None, constrained_layout=None, *, layout=None, **kwargs)
.add_subplot()
.add_axes()
.subplots()
.add_gridspec()
.autofmt_xdate(bottom=0.2, rotation=30, ha='right', which='major')
.colorbar(mappable, cax=None, ax=None, use_gridspec=True, **kw)
.legend()
.suptitle()
.supxlabel(); .supylabel()
.text(x, y, s, fontdict=None, **kwargs)
.savefig(fname, *, dpi='figure', format=None, metadata=None,
bbox_inches=None, pad_inches=0.1,
facecolor='auto', edgecolor='auto',
backend=None, **kwargs)
.set(*...)
.set_label(s)
.set_alpha(alpha)
.set_constrained_layout(constrained)
.set_constrained_layout_pads(*, w_pad=None, h_pad=None, wspace=None, hspace=None)
.set_dpi(); .set_edgecolor; .set_facecolor()...
.gca()
.get_axes()
.get_children()
.get_edgecolor(); .get_facecolor()
.get_figheight(); .get_figwidth()
|
🔥Axes-绘图区
class matplotlib.axes.Axes,类的属性及方法
创建,有很多种方式
1
2
3
4
5
6
7
8
9
10
11
12
13
14
15
16
17
18
19
20
21
22
23
24
25
26
27
28
|
fig, ax = plt.subplots(ncols=2, nrows=3, figsize=(12,8), sharex=True)
axs[2, 0].plot([1,2,3,4,5])
ax_list = ax.flatten()
fig = plt.figure(figsize=(10, 8))
ax = fig.add_subplot(1, 1, 1, aspect=1)
ax = fig.add_subplot(111, aspect=1)
fig = plt.figure()
ax1,ax2 = fig.add_subplot(1, 2, 1, aspect=1),fig.add_subplot(1, 2, 2, aspect=1)
plt.show()
fig = plt.figure()
ax1,ax2 = fig.add_subplot(1, 2, 1, aspect=1),fig.add_subplot(1, 2, 2, aspect=1)
plt.show()
axes.twinx()
axes.twiny()
.sharex()
fig = plt.figure(constrained_layout=True)
gs = fig.add_gridspec(3, 3)
f_ax1 = fig.add_subplot(gs[0, :])
...
|
绘图(快速绘图)
1
2
3
4
5
6
7
8
9
10
11
12
13
14
15
16
17
18
19
| .plot()
.scatter()
.bar()
.pie()
.hist()
.boxplot()
.hexbin(); .hist2d()
.stackplot()
.violinplot()
.imshow()
.vlines()
.hlines()
.fill_between()
.fill_betweenx()
.fill()
|
添加注释
1
2
3
4
5
6
7
| .annotate()
.text()
.secondary_xaxis()
.secondary_yaxis()
.arrow()
.inset_axes()
.table()
|
要素属性设置
1
2
3
4
5
6
7
8
9
10
11
12
13
14
15
16
17
18
19
20
21
22
23
| .set_xlim(); .get_xlim()
.set_ylim()
.set_xbound(); .set_ybound()
.set_xlabel();.set_ylabel()
.set_title()
.set_xticks(); y...
.set_xticklabels()
.minorticks_off(); .minorticks_on()
.ticklabel_format()
.tick_params()
.locator_params()
.set_position()
.set_xscale()
.set_yscale()
.set_xmargin()
.set_ymargin()
.set_aspect()
.legend()
h, l = ax.get_legend_handles_labels()
.invert_xaxis();.invert_yaxis()
|
外观开关设置
1
2
3
4
5
6
7
8
9
10
11
12
13
14
15
|
.set_axis_off()
.set_axis_on()
.grid()
.get_facecolor()
.set_facecolor()
.get_xaxis()
.get_yaxis()
ax.get_xaxis().set_visible(False)
ax.get_yaxis().set_visible(False)
ax.get_xaxis().set_ticks([])
ax.get_yaxis().set_ticks([])
ax.xaxis.set_ticklabels([])
ax.yaxis.set_ticklabels([])
|
元素添加及参考系变换等,我们可以自行创建任意的图像然后添加到axes中
1
2
3
4
5
6
7
8
9
10
| .add_artist()
.add_child_axes()
.add_collection()
.add_image()
.add_line()
.add_patch()
.add_table()
.get_xaxis_transform
.get_yaxis_transform
|
Spines-边框
class matplotlib.spines.Spine,类的属性及方法
属性设置
1
2
3
4
5
6
7
8
9
10
11
12
13
|
ax.spines['top'].set_visible(False)
ax.spines.top.set_visible(False)
ax.spines[['top', 'right']].set_visible(False)
ax.spines[:].set_visible(False)
.set_bounds(low=None, high=None)
.set_color(c)
.set_position(position)
.set_patch_circle()
set_patch_arc(center, radius, theta1, theta2)
|
Text-文本
class matplotlib.text.Text,类的属性及方法
1
2
3
4
5
| class matplotlib.text.Text(x=0, y=0, text='', color=None, ...)
# 先添加文本
text = ax.text(s = "注释",x,y,c = 'r'...)# 可以通过这样的方式获取文本示例再设置属性
# 批量设置
.set(*, agg_filter=<UNSET>, alpha=<UNSET>, animated=<UNSET>,...)
|
属性具体设置
1
2
3
4
5
6
7
8
9
10
11
12
13
14
15
16
17
18
19
20
21
22
23
24
25
26
| .set_text(s)
.set_position((x,y))
.set_x(x)
.set_bbox(rectprops)
.set_color(color); .set_c(color)
.set_font(fp); .set_fontproperties()
.set_family.(); .set_fontfamily()
.set_fontsize(fontsize)
.set_fontstyle(fontstyle);
.set_fontweight(weight)
.set_ha(align);
.set_horizontalalignment(align)
.set_rotation(s)
.set_linespacing(spacing)
.set_math_fontfamily(fontfamily)
.set_usetex(usetex=True)
.update(kwargs)
.update_from(other)
|
后续
待办
- 绘图逻辑与思路
- Matplotlib绘图初始设置模板(包含风格、字体等等的初始化)
- Matplotlib图片输出设置,空间占用与dpi的权衡……
- 绘图布局详解及案例
- 色彩及色带详解及案例
- 时间序列刻度详解及案例
- 文本及注释详解
- 其他绘图库了解及探索
- 地图绘制……
- ……


