作图时首先就要确定图片内容的布局,此处小结一下多图布局的常规操作。绘制草图及常用的图使用==subplots==进行布局即可,涉及更多元化的布局可以使用==gridspec==以及最新的==subplot_mosaic==
布局示意
这里主要记录的是多个==axes==(图形)在一张或多种画布==figure==中的布局。
新建画布的步骤可以拆成两步,也可以合并为一行代码
- 先新建一个figure(然后往其中继续添加subfigures)
- 往figiue上添加axes,即添加图形
1
2
3
4
5
6
7
8
9
10
11
12
| import matplotlib
import matplotlib.pyplot as plt
import numpy as np
matplotlib.rcParams['figure.dpi'] = 120
fig,ax_array = plt.subplots(
nrows = 2, ncols = 2,
figsize=(5,5),
layout='constrained')
fig = plt.figure(figsize=(5,5),layout='constrained')
ax_array = fig.subplots(nrows = 2, ncols = 2)
|
固定行列subplots
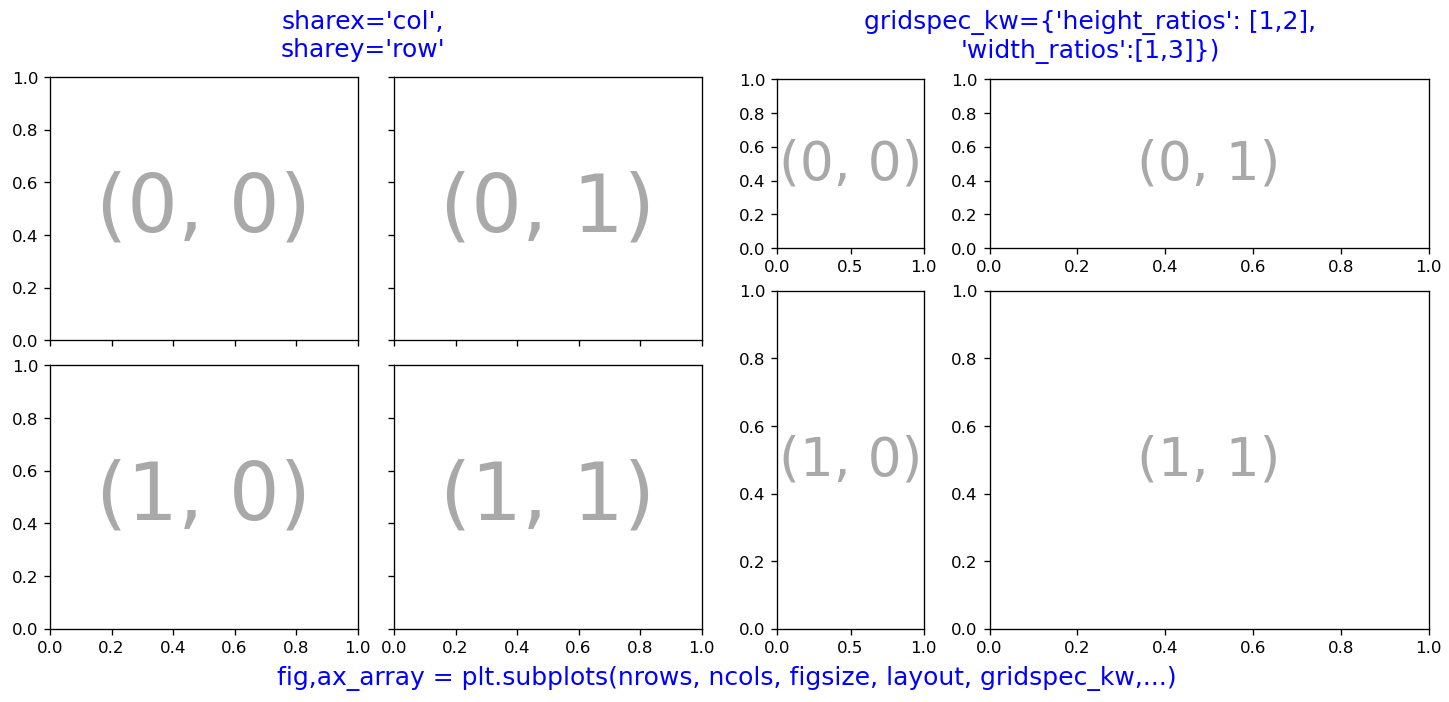
创建指定行列数默认等大小的若干图形,参数:
- nrows,ncols,行列数
- figsize=() #单位是英寸,如果设置为A4纸大小为(21/2.54,29.7/2.54)
- layout,布局,默认紧凑'constrained', 'compressed', 'tight'
- set_constrained_layout: w_pad, h_pad,调节ax周边包围的大小,单位是英寸
- sharex=‘col’, sharey=‘row’
- gridspec_kw(此参数也适用于subfigure,调整画布之间的比例等):
- wspace, hspace 调整行列之间的间隙
- height_ratios, width_ratios:调整行列图形的大小比例
1
2
3
4
5
6
7
8
9
10
11
12
13
14
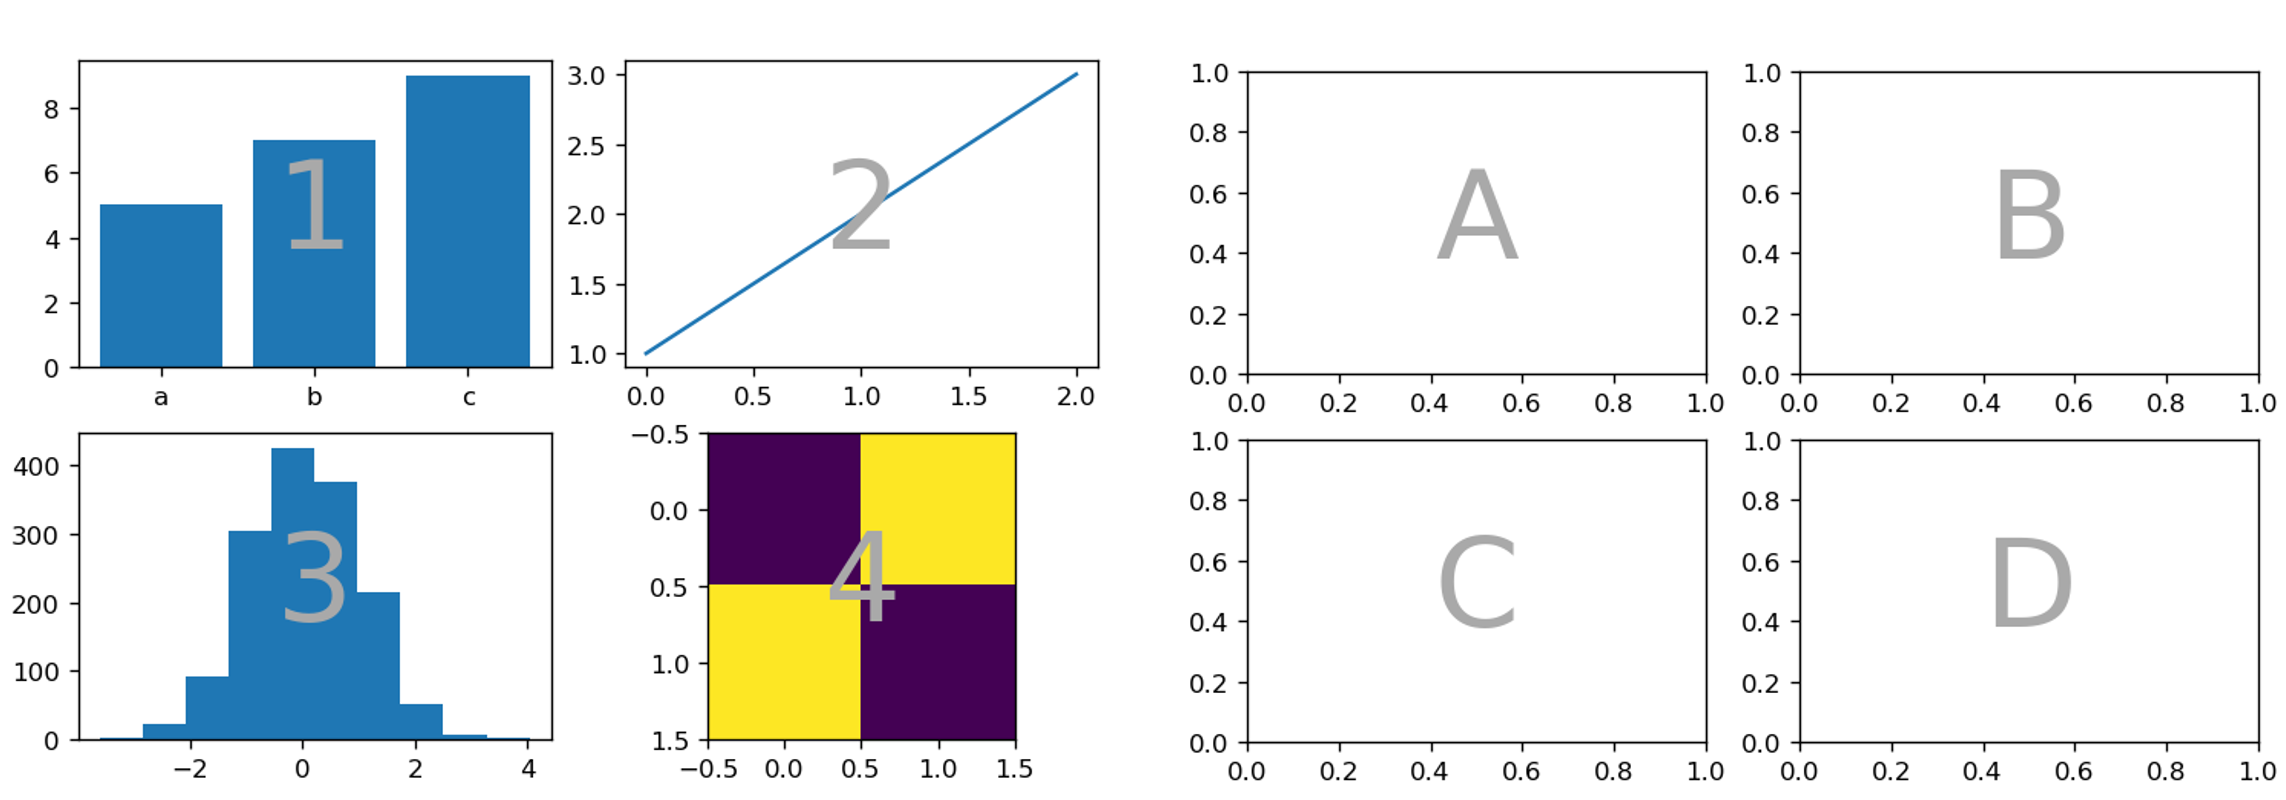
| fig,ax_array = plt.subplots(
nrows = 2, ncols = 2,figsize=(6,4),
layout='constrained')
ax_array[0, 0].bar(["a", "b", "c"], [5, 7, 9])
ax_array[0, 1].plot([1, 2, 3])
ax_array[1, 0].hist(hist_data, bins="auto")
ax_array[1, 1].imshow([[1, 2], [2, 1]])
|

其他参数示例:
1
2
3
4
5
6
|
fig,ax_array = plt.subplots(2,2, sharex='col',sharey='row',
gridspec_kw={'hspace': 0,
'wspace': 0})
fig,ax_array = .subplots(2,2,gridspec_kw={'height_ratios': [1,2],'width_ratios':[1,3]})
|

格网布局gridspec
将平面划分为若干行列的网格,然后选取若干“网格填色”组成预期的布局
用法示例
添加的步骤代码:
- 创建Figure:fig = plt.figure()
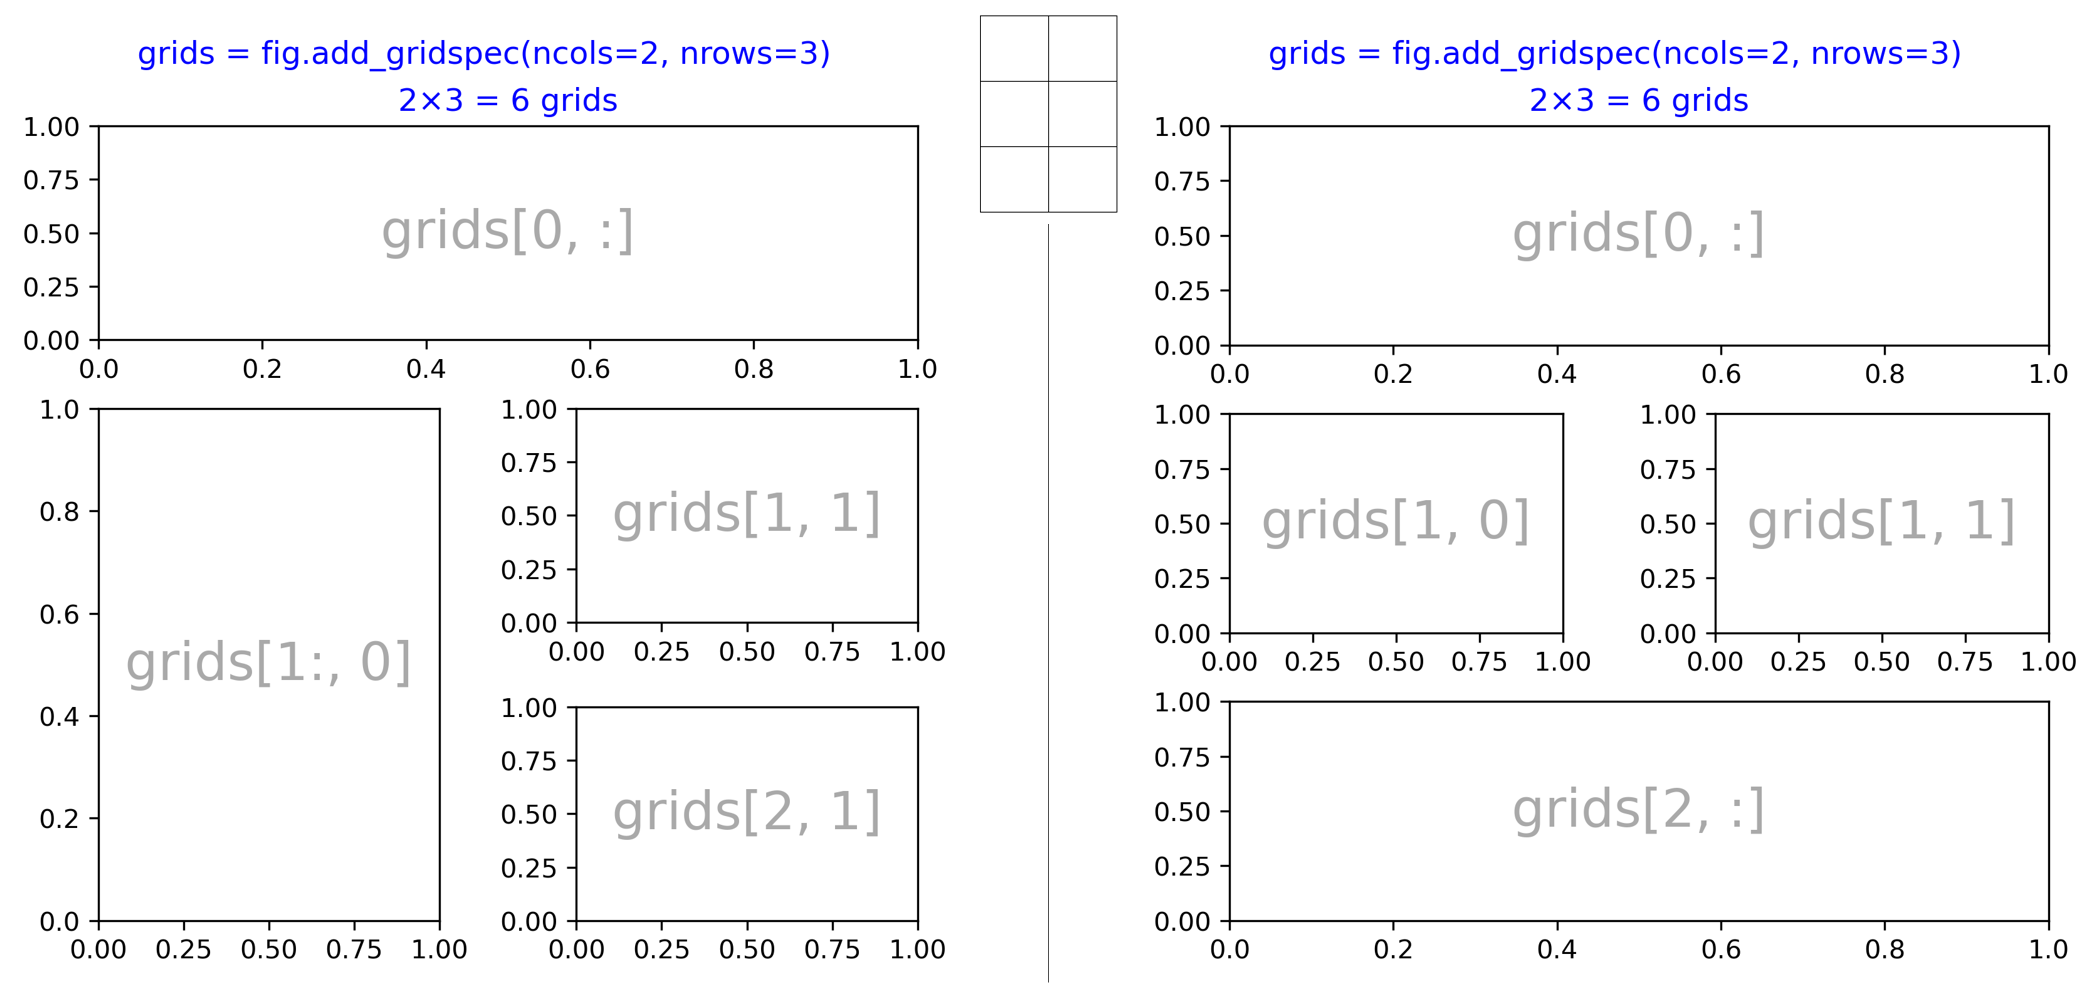
- 创建并添加格网:grids = fig.add_gridspec(ncols=2, nrows=3)
- 选取格网创建ax:ax = fig.add_subplot(grids[0, :])
添加2*3的格网,然后合并为四个,示例如下:
1
2
3
4
5
6
7
8
9
10
11
12
13
14
|
fig = plt.figure(figsize=(5, 5), layout="constrained")
grids = fig.add_gridspec(ncols=2, nrows=3)
ax0 = fig.add_subplot(grids[0, :])
ax10 = fig.add_subplot(grids[1, 0])
ax11 = fig.add_subplot(grids[1, 1])
ax2 = fig.add_subplot(grids[2, :])
fig = plt.figure(figsize=(5, 5), layout="constrained")
grids = fig.add_gridspec(ncols=2, nrows=3)
ax0 = fig.add_subplot(grids[0, :])
ax10 = fig.add_subplot(grids[1:, 0])
ax11 = fig.add_subplot(grids[1, 1])
ax2 = fig.add_subplot(grids[2, 1])
|

嵌套的格网实现分块的布局结构,示例如下:
- 创建格网/分块 plt.figure(), fig.add_gridspec()
- 每个格网分别进行二次划分grids0[0].subgridspec()
1
2
3
4
5
6
7
8
9
10
11
12
13
| fig = plt.figure(figsize=(7, 4),layout="constrained")
gs0 = fig.add_gridspec(nrows=1, ncols=2)
gs00 = gs0[0].subgridspec(2, 2)
gs01 = gs0[1].subgridspec(3, 1)
ax1 = fig.add_subplot(gs00[0,0])
ax2 = fig.add_subplot(gs00[0,1])
ax3 = fig.add_subplot(gs00[1,0])
ax4 = fig.add_subplot(gs00[1,1])
ax5 = fig.add_subplot(gs01[0])
ax6 = fig.add_subplot(gs01[1])
ax7 = fig.add_subplot(gs01[2])
|

有时候左右两块想单独设置各自的布局及其他参数,则可以拆成两个Figure
1
2
3
4
5
6
7
8
9
10
11
| fig = plt.figure(figsize=(7, 4),layout="constrained",facecolor='w')
subfigs = fig.subfigures(nrows=1, ncols=2)
axs0 = subfigs[0].subplots(2, 2)
axs1 = subfigs[1].subplots(3, 1)
subfigs[0].suptitle('subfigs[0]\nLeft side',color='b',fontsize=12)
subfigs[0].supxlabel('xlabel for subfigs[0]')
subfigs[1].suptitle(r'supertitle subfigs[1]',color='b',fontsize=12)
subfigs[1].supylabel('ylabel for subfigs[1]')
|

形象化格网布局mosaic
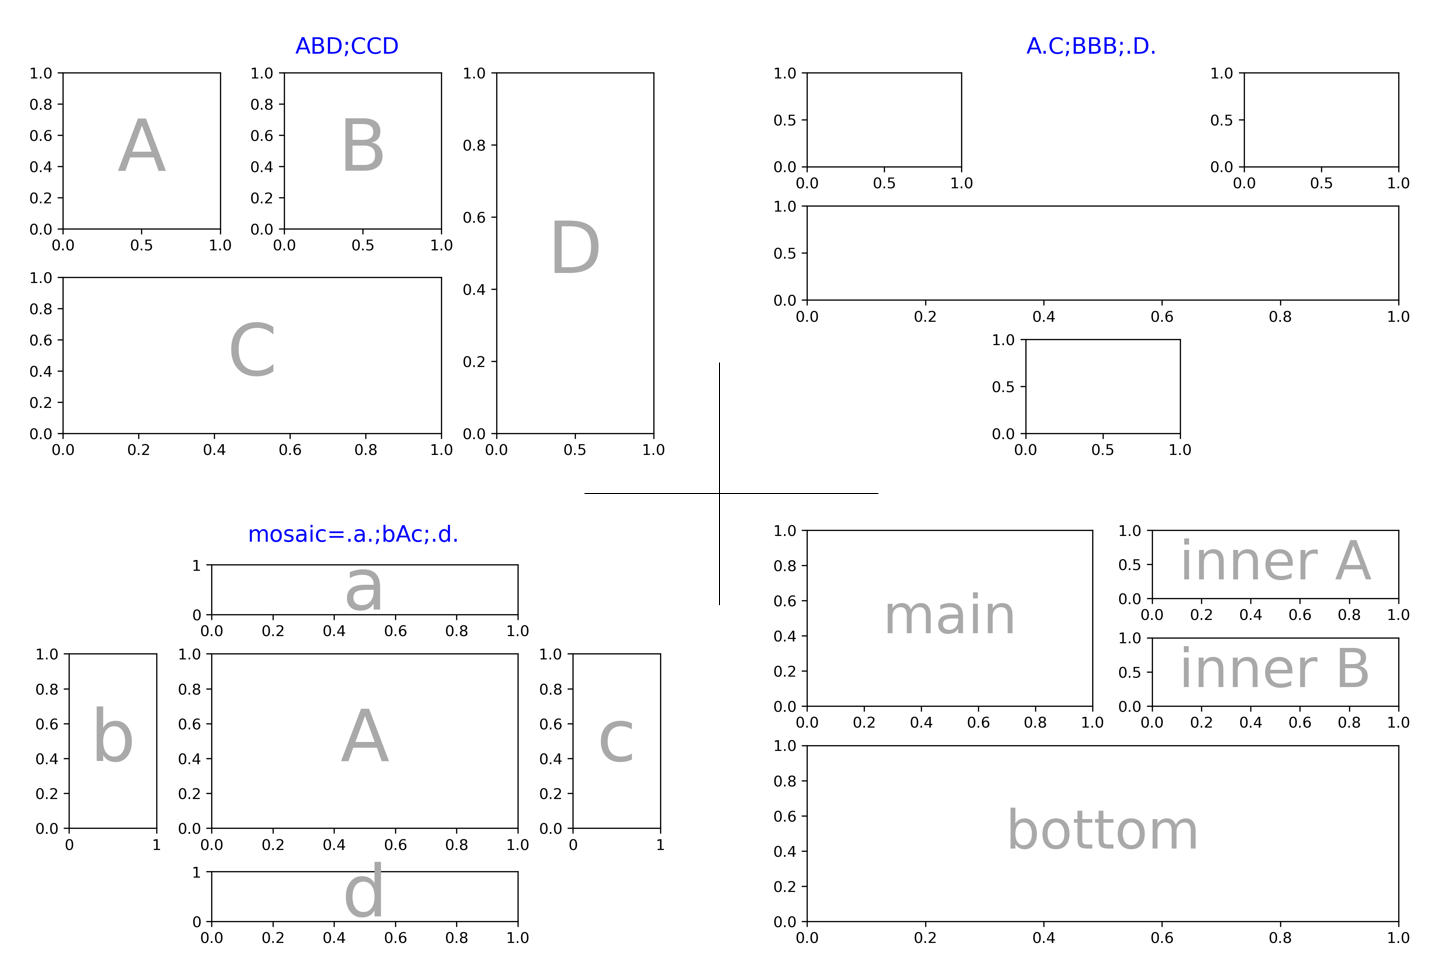
到了上面这些基本能够通过设计实现自己想要的任意布局,最新的版本还提供了更为便捷的绘图接口fig.subplot_mosaic(),可以通过字典、字符串、numpy数组表示的方式得到目标的格网布局
举例,表达方式多种多样,使用字符串即可,更多案例可以参考官方
- 获取ax的方式则变成了字典,如ax0 = ax_dict[‘A’],ax0 = ax_dict[‘1’]
1
2
3
4
5
6
7
8
9
10
11
12
13
14
| mosaic ="AB;CD"
fig = plt.figure(constrained_layout=True)
ax_dict = fig.subplot_mosaic(mosaic)
mosaic ="12;34"
fig = plt.figure(constrained_layout=True)
ax_dict = fig.subplot_mosaic(mosaic)
fig = plt.figure(constrained_layout=True)
axd = fig.subplot_mosaic(
"""
AB
CD
""")
|

更加丰富的表达:
1
2
3
4
5
6
7
8
9
10
11
12
13
14
15
16
17
18
19
20
21
22
23
24
25
26
27
28
|
fig = plt.figure(constrained_layout=True)
axd = fig.subplot_mosaic("ABD;CCD")
fig = plt.figure(constrained_layout=True)
axd = fig.subplot_mosaic("A.C;BBB;.D.")
fig = plt.figure(constrained_layout=True)
axd = fig.subplot_mosaic(".a.;bAc;.d.",
gridspec_kw={"height_ratios":[1, 3.5, 1],
"width_ratios":[1, 3.5, 1]}
)
inner = [
["inner A"],
["inner B"],
]
outer_nested_mosaic = [
["main", inner],
["bottom", "bottom"],
]
fig = plt.figure(constrained_layout=True)
axd = fig.subplot_mosaic(
outer_nested_mosaic, empty_sentinel=None
)
|

参考
- https://matplotlib.org/devdocs/tutorials/index.html
- https://matplotlib.org/devdocs/api/index.html
- https://matplotlib.org/devdocs/gallery/index.html


